Have you ever wanted to track your HR recruitment performance? If you did, this post is for you! I will describe how to create your very own Excel file to track your recruitment KPIs. Follow this guide to build your own version of a Recruitment Dashboard.
If you are more of a video person, check out the YouTube for it:
Still here? Good, here is the written description on how to build it. I usually like to structure these files in the following way:
- Data sheets – in this sheet, I input the data that I show in the dashboard.
- Parameters sheet – in this sheet, I build ranges for drop down lists and databases for matches and lookup shortcuts.
- Pivots sheet – in this sheet I build pivot tables that will feed the charts of the dashboard. This is the backend part of the dashboard and normally the users should not view this sheet.
- Dashboard sheet – this is the front end of the pivots sheet. Here is where the charts are build and slicers for easy filtering.
Data sheets :
In this file there are two data sheets – one for the Applicants status :
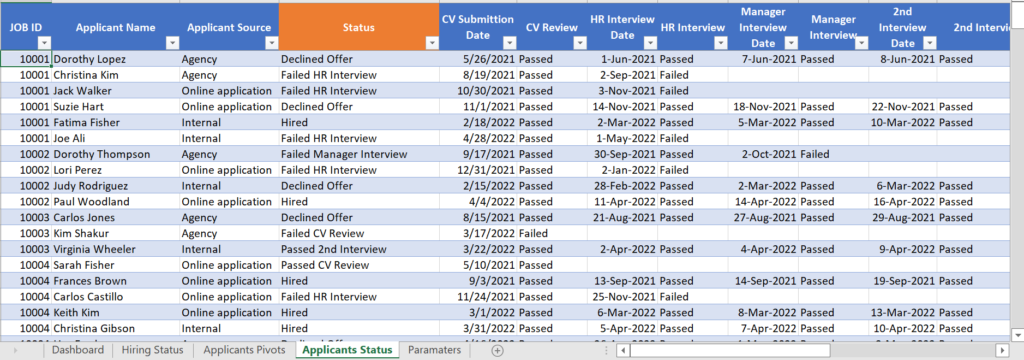
In this sheet the data columns (inputted by the user) are :
- Job ID – unique number to match a specific ID. Note that for the same ID there could be more than 1 application.
- Applicant name
- Applicant source – how did the applicant send their CV? Via agency, online or Internal (moving up!).
- Stages – date of the stage and result. Here the logic is there are X amount of stages the applicant needs to go through. I defined two options for a stage – passed or failed.
- Status – this calculated field shows the last stage that is completed, using Counta() for the stages ranges you can identify the last spot. Then just use index(headline range, 1, counta result). This will return the name of the stage. I am also using an if to check if the column start date is filled out to input the Hired status. This is how the formulas look like:
- Status index column = =COUNTA(Table1[@[CV Submittion Date]:[Offer]]) , I am using a table and so the range is between the first and last stages.
- Status =IF([@[Start Date]]>0,”Hired”,INDEX(Table1[@[CV Submittion Date]:[Offer]],1,[@[Status Index]])&” “&INDEX(Table1[[#Headers],[CV Submittion Date]:[Offer]],1,[@[Status Index]]))
- I used the &” “& part to combine the result (passed or failed) and the status name (header line).
- Counting fields – I use these fields to count the number of rows that match a criteria. It’s really helpful for pivot tables.
- App counter – always 1 per row.
- Offer counter – equals 1 if applicant received an order. Simple if IF([@[Offer Date]]>0,1,0).
- Accepted counter – equals 1 if applicant accepted the offer. Simple if IF([@Offer]=”Accepted”,1,0).
- Hired counter – another simple if. IF([@[Start Date]]>0,1,0).
- Fields pulling data from the hiring data sheet. Here I use index + match to easily pull data based on the ID# and header. For example =INDEX(Table2[#All],MATCH([@[JOB ID]],Table2[[#All],[JOB ID]],0),MATCH(Table1[[#Headers],[DEPARTMENT]],Table2[#Headers],0))
Hiring status sheet :
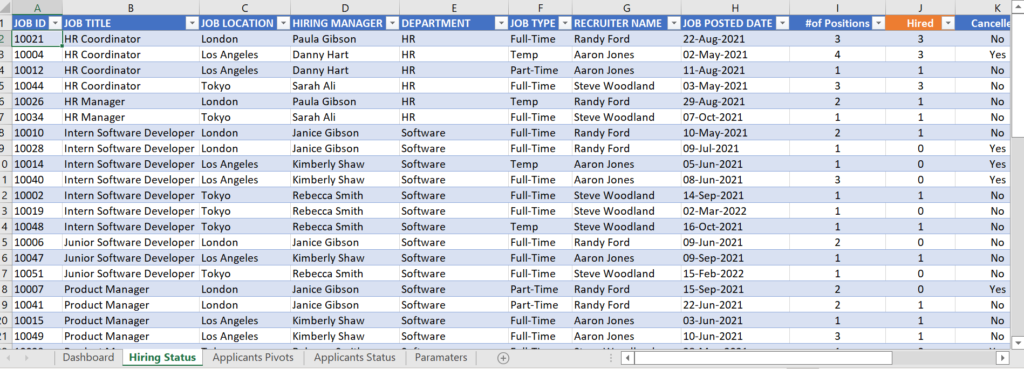
- Job ID – unique ID# for the Job. This is the key to connect both tables.
- Job title – description of the job.
- Job location
- Hiring manager
- Department
- Job type
- Recruiter name
- Job posted date
- #of positions – in case this job has more than 1 filling
- Hired – calculated field. Count the #of apps that were hired for that job in the application status sheet.. Here is the formula – COUNTIFS(‘Applicants Status’!A:A,[@[JOB ID]],’Applicants Status’!D:D,”Hired”).
- Cancelled? Give an option to manually close this line even if the #of positions was not fullfilled.
- Status – if the hired column equals the #of positions columns it is closed. If the cancelled columns is Yes then cancelled, otherwise it’s open. =IF([@[Cancelled?]]=”Yes”,”Cancelled”,IF([@Hired]<[@[‘#of Positions]],”Open”,”Closed”))
- Last Hire Start date – I’m using Maxifs to check what is the last applicant that was hired for this line’s job. =IF([@Status]=”Closed”,MAXIFS(‘Applicants Status’!P:P,’Applicants Status’!A:A,[@[JOB ID]]),””)
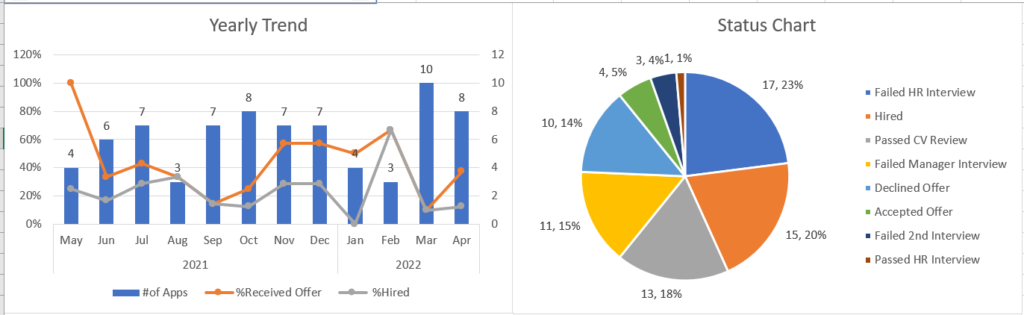
Applications pivots – here is where I build all the pivot tables I want to use to build the dashboard sheet. I like to think of this as the backend part of the dashboard. For these pivot tables I added slicers and timeline that are presented in the dashboard sheet.
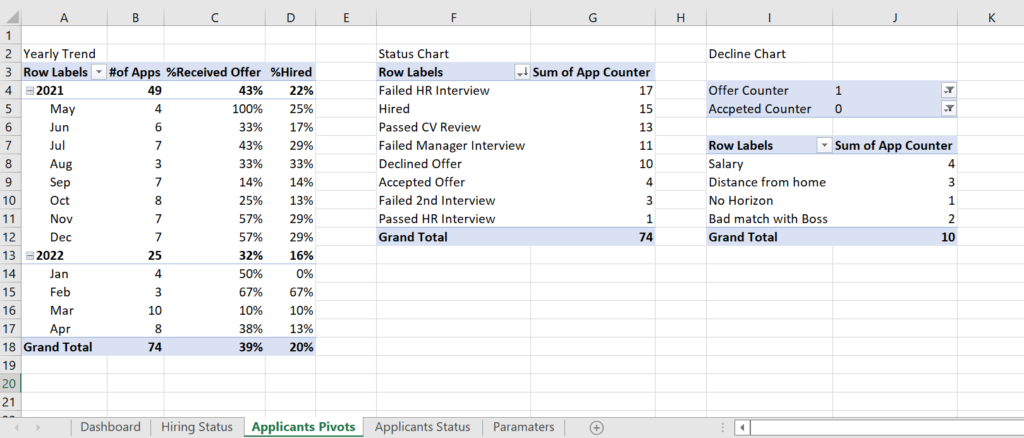
It’s important to build simple pivot tables so the charts are clear as well. I’m a fan of simple charts with a clear data to share.
Dashboard sheet – I placed the charts connected to the pivot tables are located + the slicers. This should be the main sheet of your Recruitment Dashboard.
That is a really good tip especially to those fresh to the blogosphere. Short but very accurate information… Thanks for sharing this one. A must read article!
Thank you for your feedback