Description
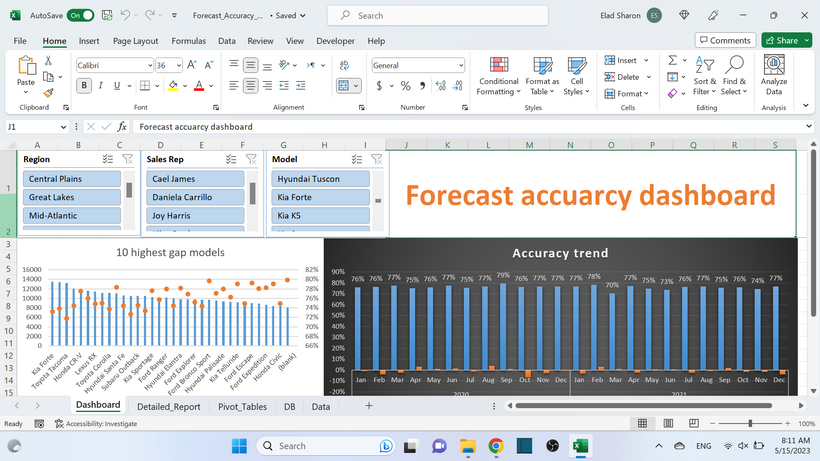
📊 Forecast Accuracy Dashboard (Excel Template)
Track, analyze, and improve your sales forecast accuracy — instantly.
✅ Key Features:
- Pre-built dashboard to visualize forecast trends and top underperforming items
- Automatically calculates key KPIs: Normalized MAPE and Forecast Bias
- Includes dynamic pivot tables and slicers for interactive analysis
- Fully customizable Excel file with formulas
- Compatible with all data hierarchies — easily adaptable to your sales structure
💡 Why You’ll Love It
Struggling to trust your sales forecast? This Excel template helps supply chain professionals and analysts quickly spot gaps between forecast and actual sales. By using normalized accuracy metrics and a clean dashboard view, you’ll save hours of manual calculation and uncover trends and inaccuracies at every level — from country to model. The included slicers and detailed report make it easy to dig deep or get a high-level overview, fast.
👥 Who It’s For:
- Supply Chain Analysts
- Sales Operations Teams
- Demand Planners
- Inventory Managers
- Data-Driven Decision Makers
📝 Please Note: This is a digital download — no refunds are available.
🔧 Requires Microsoft Excel . No additional setup needed — just plug in your data!

Reviews
There are no reviews yet.