I helped someone out with trying to find the Median and excluding the outliers. He had ~14K lines of data, at first he manually reviewed the data in a specific column and flagged which data points were outliers. That took a long time, was not very accurate and he had to do it for another 4 data points so it was a tough task to be done manually. He contacted me and I offered to take a look and try to see how it can be done in a better way.
Using Power Pivot
At first I wanted to use pivot tables, but median is not part of the values that you can choose from. So I looked it up and found Power Pivot. From what I saw and read power pivot as the name suggests is a stronger / more analytical form of pivot. Basically it allows you to calculate much more function than pivot. For pivot you only have 12 values – sum, count, min, max etc. In power pivot there are many more including Median.
How to install Power Pivot
In order to use power pivot you need to install it, it’s pretty simple.
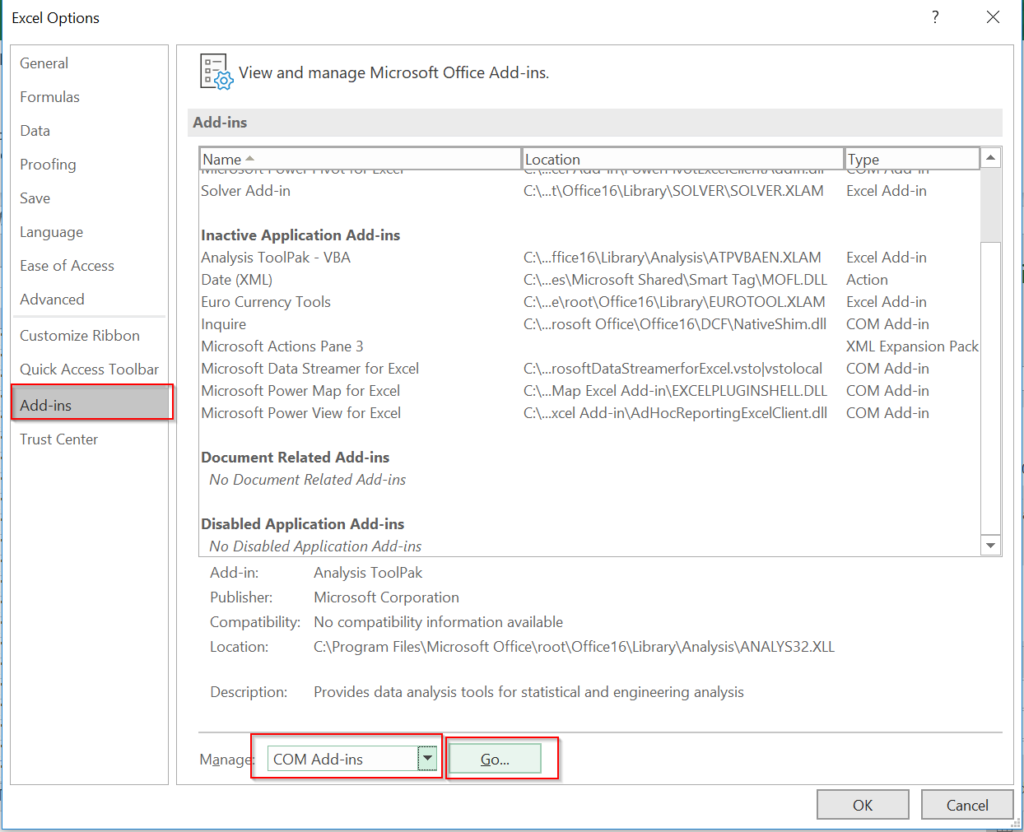
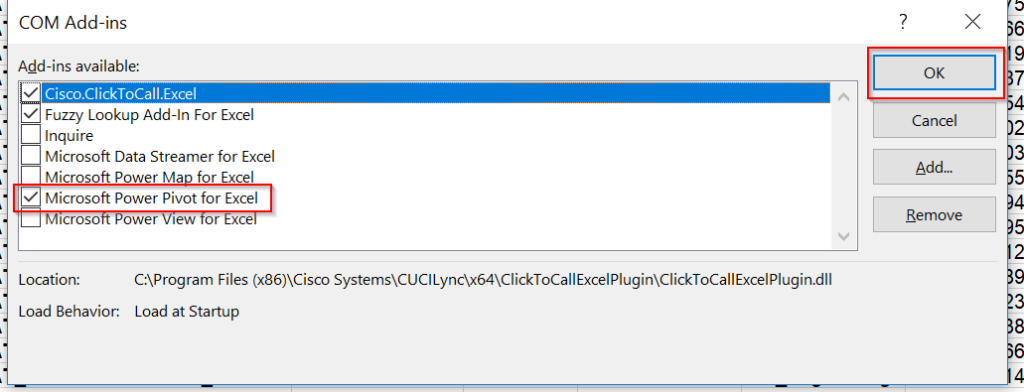
Go to file>options>add-ins in the manage box at the bottom select “COM Add-ins” and click on go. Then check the box the left of Microsoft Power Pivot for Excel and click on ok.


How to calculate the Median
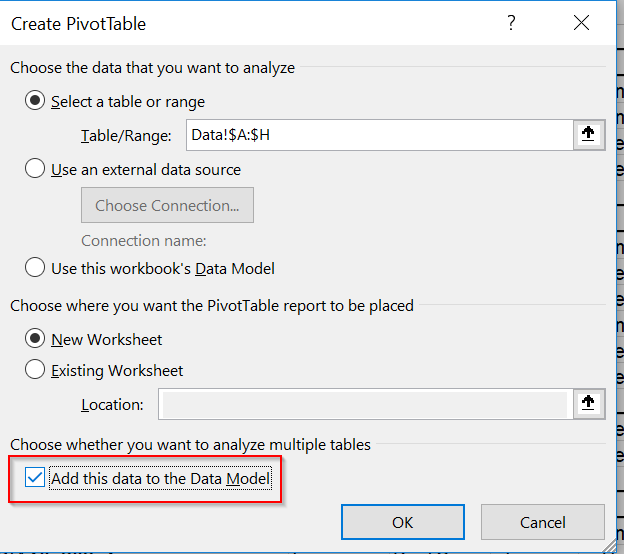
Next you need to setup the power pivot table. It starts the same as a regular pivot table, you select the date and click on insert pivot table. The only difference is that you need to check the box “Add this data to the data Model”.

After setting up the rows, columns and filters you want you can add the Median. To do that you need to add a Measure, this is done by clicking on the power pivot tab on top and clicking on new measure.

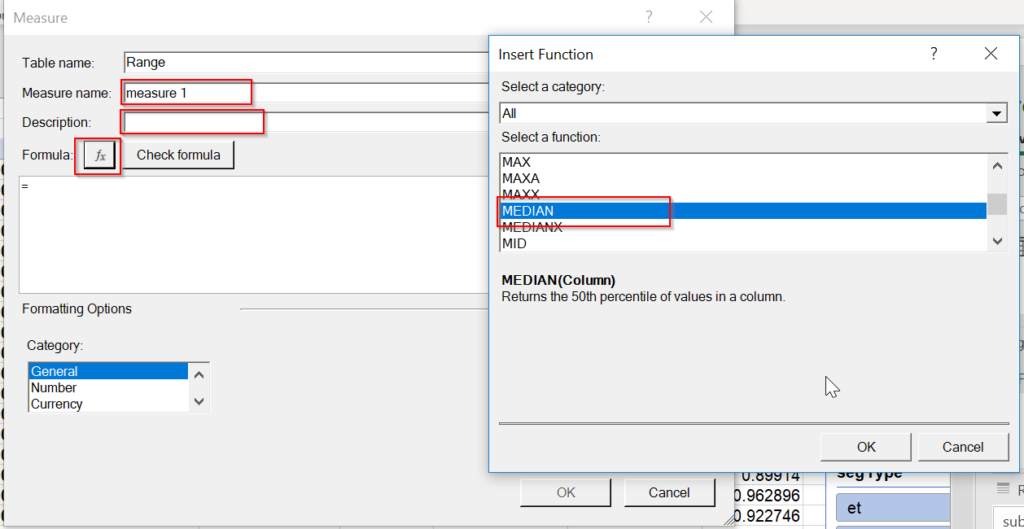
Next you need to select which measure to use. I recommend you give the measure a unique name + a description so it’s clear. After adding the text, click on fx and you will see all the possible measures available.

Now you get the formula and you can key in the input, in this case you need the set the range or the column of data that you want to perform the median. Some of them measures require more than one argument and you need to treat them like a regular function. Once that is completed you will have another data to plat with in the fields list. You will see fx before it indicating it’s a calculated measure. That was part 1 – how to quickly calculate the Median, now I needed to complete pare 2 – find the outliers.
How to find the Outliers?
To identify the outliers you need to calculate 5 elements :
- The first Quartile (Q1) – this number is the the upper boundary for the lowest 25% of the data.
- The third Quartile (Q3) – this number is the the upper boundary for the lowest 75% of the data.
- Interquartile range (IQR) = Q3-Q1 , simple formula
- Lower bound = Q1 – 1.5 * IQR
- Upper bound = Q3 +1.5 *IQR
These are taken from statistics and are a common practice.
Luckily I could calculate Q1 and Q3 using the measures in power pivot. To calculate Q1 or Q3 use PERCENTILE.INC or PERCENTILE.EXC depends if you want to include or exclude the first and last value in the data. Both formulas require the data you wish to work on and the % of values. For Q1 use 0.25 and for Q3 use 0.75.
Once we calculated Q1,Q3 I added three measures with the formulas above and now we have a power pivot table with all 5 elements and most importantly the upper and lower bound. We are going to use them in our original data table.
Passing the outliers to the original database
Now that we have the bounds set up, we need to add them to our original database. That way we can add a simple formula for each line and identify if this row is an outlier. To achieve this I simply used Sumifs to pull the lower and upper bound from the power pivot. If you are not familiar with this function, pleas click on this link for a detailed description – Sumifs.
Depending on the outliers you are building, you would need to set up the ifs part accordingly. Once you build the lower and upper bound with the sumifs, you can add a simple formula about if the value is between them. If not that it’s an outlier. Now you can use that new column as a filter in your power pivot table.
This method is very simple and efficient , for this customer I created 3 different median and outliers so it was very handy for me.
