Can we build an Excel file that will show us the #of containers that are at risk for demurrage and detention? That’s how this thing started, and by the end we built something that could do much more. Using VBA coding, excel formulas (simple and complicated), pivot tables and charts I created a user friendly logistics control tower. In this post I will cover the main aspects of this project.
Project goals:

- Allow the users an ability to view the position of the entire supply chain containers – how many containers are in transit, in storage.
- Review high risks for warehouse overloading
- Analyse historical costs
- Predict expected costs
- Expected demurrage and detention costs alert screen prompting warehouse managers to release them asap.
Data sources:
- 3 different shipping companies reports – each with a unique format and data names
- ERP report showing containers that are expected to be shipped out
- 3 different inland logistics companies report
Description of the solution:

I developed a custom VBA based excel file. These were the main steps of the file:
- Clear the current database
- Copy the updated data files from the directory
- Merge all the files into one sheet
- Create a unified database where under one headline will appear the data from many columns. For example, the container# is column D in one source and column H in another.
- Delete all pictures and unrequired data to shrink file size
- Freeze the date – critical for demurrage and detention cost calculations
- Clean up the data based on user definitions – replace blanks with zeros, fill in missing data from fixed table.
- Build filters based on user requests – shipping company, container type etc. These will be used in the dashboard.
- Calculate expected demurrage and detention costs for live containers based on costs table per shipping company and destination.
- Define default values is any critical are missing.
- Created a “dictionary” between different sources. For example, you would see US, USA and The United states of America in different sources. In the file they would all show as USA.
- Paste all cells by value to shrink file size
User interface:
- The user needs to replace the source files in the directory on their server
- The user needs to press the upload button, the code will run and populate a message that will notify the user if the code ran or if there was an issue. In the end the user will receive a data message that is supposed to give a clue if the data is ok. For example, it can show the last delivery date, total # of containers, costs etc.
- There is a data issue sheet that will show the user all the bugs in the data. These were defined by the user – for example a container without any weight, a container without a destination, cost etc.
- The user should correct the data and press the upload button again.
- Assuming no data issues appear, the user will view the file’s main outputs:
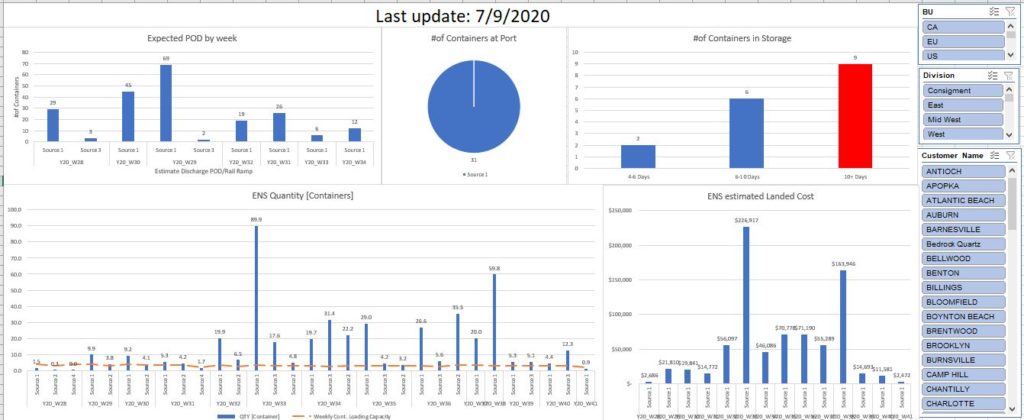
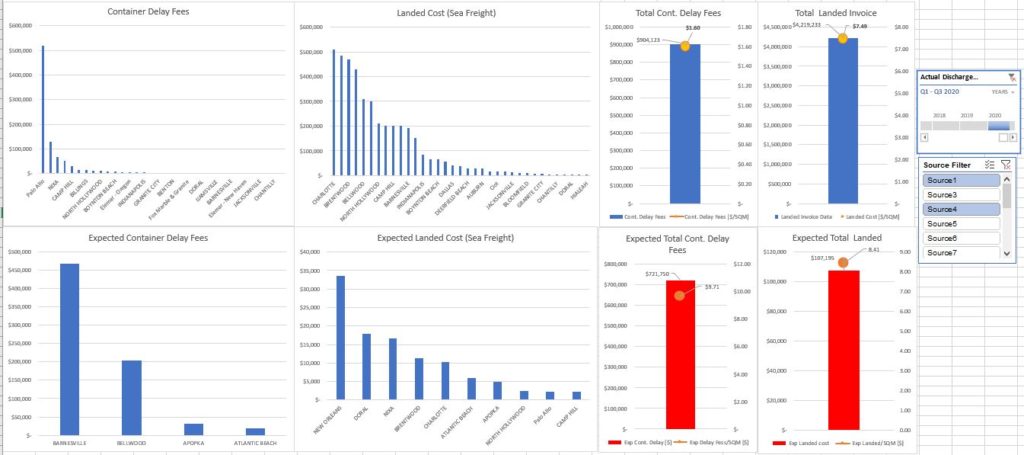
- A graphical dashboard showing all the required KPIs + the ability to filter easily based on time, distention, source etc.
- Alerts – this sheet can be used to prioritize which containers should be unloaded and sent back to the shipping companies to avoid demurrage and detention costs.
- Custom made pivot tables for pre-determined analysis.
- Detailed flat data sheet to view as see fit.
- The user can press a button and a duplicate file named LCT_Week#_Year# will be created in the directory for future analysis.